The Math: How $30,000 of Credit Card Debt Becomes $84,000 (And Steals 34 Years of Your Life)
By Your Debt Advocate · Updated 2026
The minimum payment box on your credit card statement is the most expensive financial product most American families ever buy.
That sentence sounds like a slogan. It's actually a math statement. This article walks through the numbers in plain English, with sourced inputs, so you can see exactly what carrying credit card debt costs over a lifetime — and exactly why most families never recover that money even after the cards are eventually paid off.
The Setup
For this walkthrough, we'll use a specific example. Adjust the numbers in your head to match your situation; the math runs the same way.
- Starting balance: $30,000 spread across credit card accounts
- Average APR: 22% — close to the current national average of around 22% on accounts assessed interest (Federal Reserve G.19, Q1 2026)
- Minimum payment: 1% of balance plus interest — the post-CARD-Act formula most major card issuers use today, designed by federal rule to actually amortize the balance over time
- No new charges: Family stops adding to the balance and pays only the minimums
This is the cleanest version of the math. Most real families add new charges along the way, which makes the actual numbers worse than what we're about to walk through.
The Time-to-Payoff Math
Paying the post-CARD-Act minimum (1% of balance plus interest) on $30,000 at 22% APR takes roughly 34 years to clear the balance. The exact number depends on the specific minimum-payment formula your issuer uses, but the range is reliable across major banks.
Time to pay off $30,000 at 22% APR with the post-CARD-Act minimum payment.
Why so long? The minimum payment formula is designed to amortize but barely. Most of every early payment goes to interest. As your balance drops, your minimum payment drops too — so you make slightly less progress each year. The principal payoff curves into a long tail. The interest keeps accruing on the remaining balance every single month.
Pre-CARD-Act formulas were even worse. Before federal reform in 2009, many issuers used a flat "2% of balance" minimum that would mathematically never fully amortize a high-APR balance under realistic conditions — the interest just outpaced principal reduction. The CARD Act forced the change so balances would actually pay down. They still pay down very slowly.
The Total-Paid Math
Over those ~34 years, the total amount you actually pay back to the card company on a $30,000 starting balance comes to roughly $84,000.
Total paid over the lifetime of the loan on $30,000 of credit card debt at 22% APR with post-CARD-Act minimum payments.
Of that $84,000, roughly $54,000 is interest. The remaining $30,000 is the original principal.
Stated differently: you pay back the original $30,000 once, and you pay back roughly 1.8x that same amount again in interest. The $30,000 you owed becomes nearly three times that much before you're done.
The Hidden Tax: A Day a Week of Your Take-Home
Here is the part most families never quantify.
For a household with $80,000 in gross annual income, take-home pay after taxes typically runs $60,000-$65,000 per year — roughly $5,000-$5,400 per month.
Post-CARD-Act minimums on $30,000 of card debt run roughly $850/month at the start (the 1% balance + 22% / 12 interest portion), declining as the balance drops. Add a car loan, a student loan, occasional new charges, and most American families with serious card debt are sending 15-20% of their after-tax earnings to lenders every month. That share never goes to retirement, college funds, vacations, or wealth-building.
Run the math another way. $30,000 × 22% = $6,600/year going to interest alone. For a household earning ~$60,000 take-home, that's about 11% of pre-tax income — roughly equivalent to one day's earnings each week disappearing to interest, before any principal moves.

If you want to know what your debt is really costing you in time, divide your monthly debt service by your monthly take-home pay. Multiply by 5. That's how many days a week you're working for the bank.
The Opportunity Cost: What That Money Would Have Become
The interest math is the visible cost. The opportunity cost is the bigger one.
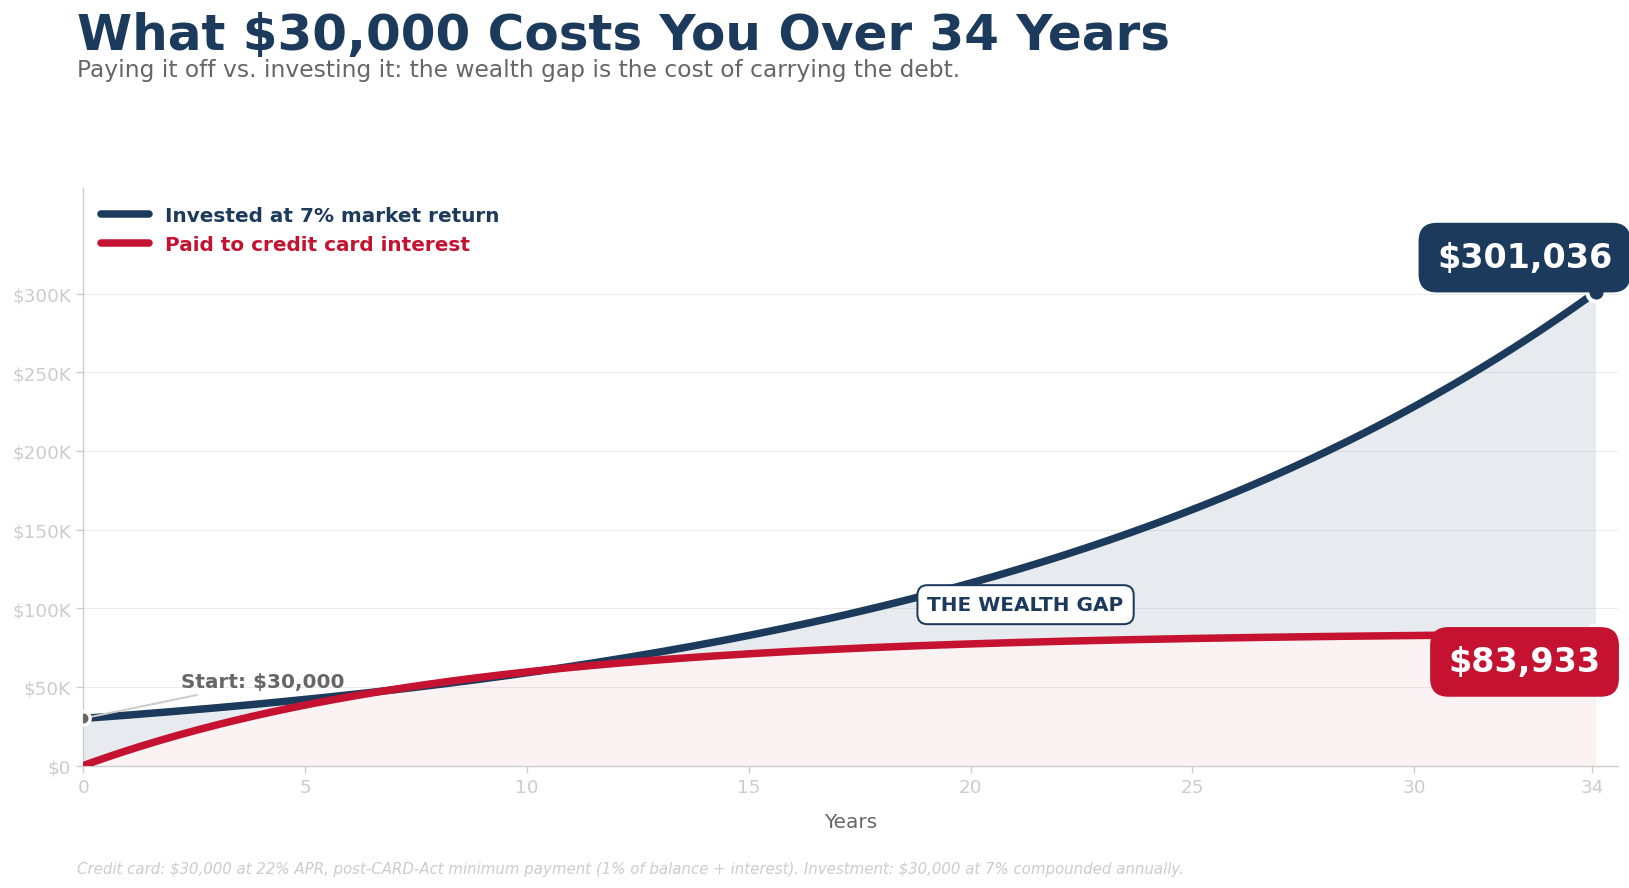
Imagine the same $30,000 — the original card balance — invested at market average returns of 7% annually instead of paying card interest at 22%. The S&P 500 has returned roughly 7% annualized real (after-inflation) over 30+ year periods, per Ibbotson/Morningstar SBBI data.
Over 34 years (the same window the card debt would take to pay off), $30,000 invested at 7% real returns compounds to:
What $30,000 invested at 7% annualized real returns becomes after 34 years of compounding.
And that's just the principal. If you're also redirecting the equivalent of your minimum-payment dollars into investment instead, that compounds into hundreds of thousands more over the same 34-year window.
The Total Swing
Pull all three numbers together for a $30,000 starting position over the 34-year payoff window:
| Path | What you actually do | Where you end up |
|---|---|---|
| Path A: Minimum payments forever | Pay roughly $84,000 to card company over 34 years. Invest nothing extra. | $0 net wealth from those dollars. 34 years gone. |
| Path B: Same dollars invested instead | Original $30,000 in market + payments redirected from minimums into investment. | Roughly $1 million in invested wealth after 34 years (the original $30K compounding to ~$301K, plus redirected minimum-payment dollars). |
The total swing is several hundred thousand dollars over a working lifetime. That is the cost of carrying $30,000 of card debt at 22% interest from age 30 to age 65.
Not the cost of bad luck. Not the cost of a recession. The cost of one credit card balance and one minimum-payment habit.
The Rule of 72: A Mental Shortcut
Financial planners use a quick formula called the Rule of 72 to estimate doubling time. Divide 72 by the interest rate to get the years it takes for money to double at that rate.
Apply the Rule of 72 in two directions:
Going Up (Investment Growth)
72 ÷ 7 (market return) = roughly 10.3 years. Your invested money doubles every ~10 years.
$30,000 invested at age 35 becomes:
- $60,000 by age 45
- $120,000 by age 55
- $240,000 by age 65
Going Down (Debt Cost)
72 ÷ 22 (card APR) = roughly 3.3 years. Your card balance would double every ~3 years if you paid no principal at all.
You're paying SOME principal with the post-CARD-Act minimum payments, which is why it takes 34 years instead of growing forever. But the underlying math force is what makes minimum-payment payoff timelines so long. The interest on a 22% APR balance is racing the principal payment, and the interest has roughly a 7x speed advantage.
The Net-Worth Gap By Age 65
Federal Reserve Survey of Consumer Finances data shows significant net-worth gaps between American households with persistent credit card debt and those without — often hundreds of thousands of dollars by retirement age. The gap is real and large, even if the specific dollar figure varies by income tier and age cohort.
That gap is not because credit-card-carrying families are bad with money or worked less hard. It's because the math runs against them every month for decades. The cards take a percentage of every paycheck before any wealth-building happens.
You can fix the wealth-building problem at age 30. You can fix it at age 50. You cannot fix it at age 70. The compounding window only opens in one direction.
What Resolution Does to These Numbers
Walk through the same $30,000 with debt resolution instead of 34-year minimum payments.
Avalanche Self-Pay (Aggressive Minimums Plus)
If the family redirects an extra $400/month into the highest-rate card and uses the avalanche method, the $30,000 clears in roughly 5-6 years. Total paid: approximately $42,000. Time saved versus minimum-payment treadmill: ~24 years. Wealth-building can begin around age 41 instead of age 65.
Debt Forgiveness
$30,000 enrolled. Average settlement at 50% across accounts. Specialist fees at ~20% of original balance. Total paid over 30-36 months: approximately $21,000. Time to debt-free: under 3 years. Wealth-building can begin around age 38.
Bankruptcy (Chapter 7)
$30,000 fully discharged. Total out of pocket: roughly $1,500-$3,000 in filing and attorney fees. Time to debt-free: 3-6 months. Wealth-building can begin immediately, though credit recovery takes 2-3 years before favorable rates return.
Each of these paths replaces 34 years of $84,000 payouts with 1-6 years of meaningfully smaller payouts. The remaining decades become wealth-building years instead of debt-service years.
That's the math the credit card industry doesn't lead with.
The Honest Bottom Line
Carrying $30,000 of credit card debt at 22% APR with minimum payments costs roughly $84,000 in raw payouts over 34 years. The opportunity cost (what the same money would have built invested) is several times that.
The total lifetime swing — debt cost + missed compounding — is approximately a million dollars over a working lifetime for a single $30,000 starting balance.
Resolution paths exist. The math gets better the earlier they're used. For families with $10,000+ in unsecured debt who fit the profile, debt forgiveness usually resolves the situation in 24-36 months and reopens the wealth-building window.
Whatever path fits your specific numbers, the most expensive option is to keep doing what most families do — pay the minimums and hope it works out. It almost never works out without intervention.
What To Do Next
- Pull out a recent credit card statement. Look at the "minimum payment warning" box that's been required since 2010 — it tells you exactly how long the issuer estimates your specific balance will take to pay off at minimum payments. Most families have never read it.
- Multiply your monthly minimum across all cards by 12 to get annual cost. Multiply that by years remaining to your retirement age. That's your minimum-only lifetime cost.
- Compare against debt forgiveness math. Roughly half of face value plus specialist fees over 24-36 months is the typical all-in. Compare against your minimum-only number.
- Take the Free Debt Relief Assessment. A senior specialist will run the exact math on your specific debts. No cost. No obligation.
Common Questions
Why is the minimum payment formula 2% of balance?
Card issuers used to set minimums at 2% of balance until federal banking regulators in 2003-2005 pushed them toward higher minimums (closer to 4% effective minimums) so balances would actually pay down. Most issuers settled around 1-2% of principal plus interest plus fees, often with a $25 floor. The exact formula varies by issuer.
Are credit card APRs really that high?
Yes. The Federal Reserve's G.19 data tracks average credit card APRs across major issuers. As of Q1 2026, the average APR on accounts assessed interest is around 22%, and the all-accounts average is around 21%. Subprime cards run 28-36%. Store cards often run 28-30%. Premium cards can run lower for the highest credit tiers.
What if I'm paying more than minimums?
Run the math at your actual payment amount. The percentage that goes to interest vs. principal early in a balance is high — most of an early payment is interest. The formula gets better as the balance drops. Online amortization calculators run the exact numbers if you input balance, APR, and monthly payment.
Does the 7% market return assumption hold up?
Long-term historical equity returns in the U.S. have averaged roughly 7% real (inflation-adjusted) and roughly 10% nominal over the long historical record. Past performance does not guarantee future returns. Conservative planners often use 5-7% for projections. The math works at any reasonable assumption — it's the gap between debt rate and investment rate that matters most.
What if my debt is at lower APRs (say, 0% intro or balance transfer)?
Low-rate balance transfers buy time, not solutions. Most 0% promo windows run 12-21 months and revert to standard APRs after. If the underlying debt isn't paid by the end of the promo, you're back to standard card-rate math. Use promo windows aggressively if you have one.
Sources & References
Federal Reserve Statistical Release G.19, Consumer Credit (Q1 2026 release). Federal Reserve Bank of New York, Quarterly Report on Household Debt and Credit. CARD Act of 2009 minimum payment disclosure requirements (15 U.S.C. Section 1637). Ibbotson/Morningstar SBBI historical equity returns data. Federal Reserve Survey of Consumer Finances 2022.
This article is for consumer education only. It is not financial, investment, or tax advice. Your Debt Advocate is not a financial advisor or investment manager. Past investment returns do not guarantee future results. Every household's situation is different. A senior debt specialist can review your specific numbers through the Free Debt Relief Assessment.
See What Resolution Could Mean for Your Specific Numbers
The lifetime math of carrying credit card debt is bigger than most families realize. Resolution math is the inverse — and it usually rebuilds the compounding window before retirement.
Free Assessment
Run debt resolution math against your actual numbers. A senior specialist will tell you what it would mean.
Read the "minimum payment warning" box on your next statement. It's been required by law since 2010. Most families have never looked at it. The number on it is honest.